Detailed · Deep study
1Creating a chart
- Select the data: contiguous (cells next to each other), non-contiguous (separate columns/ranges – hold Ctrl), or a specified range.
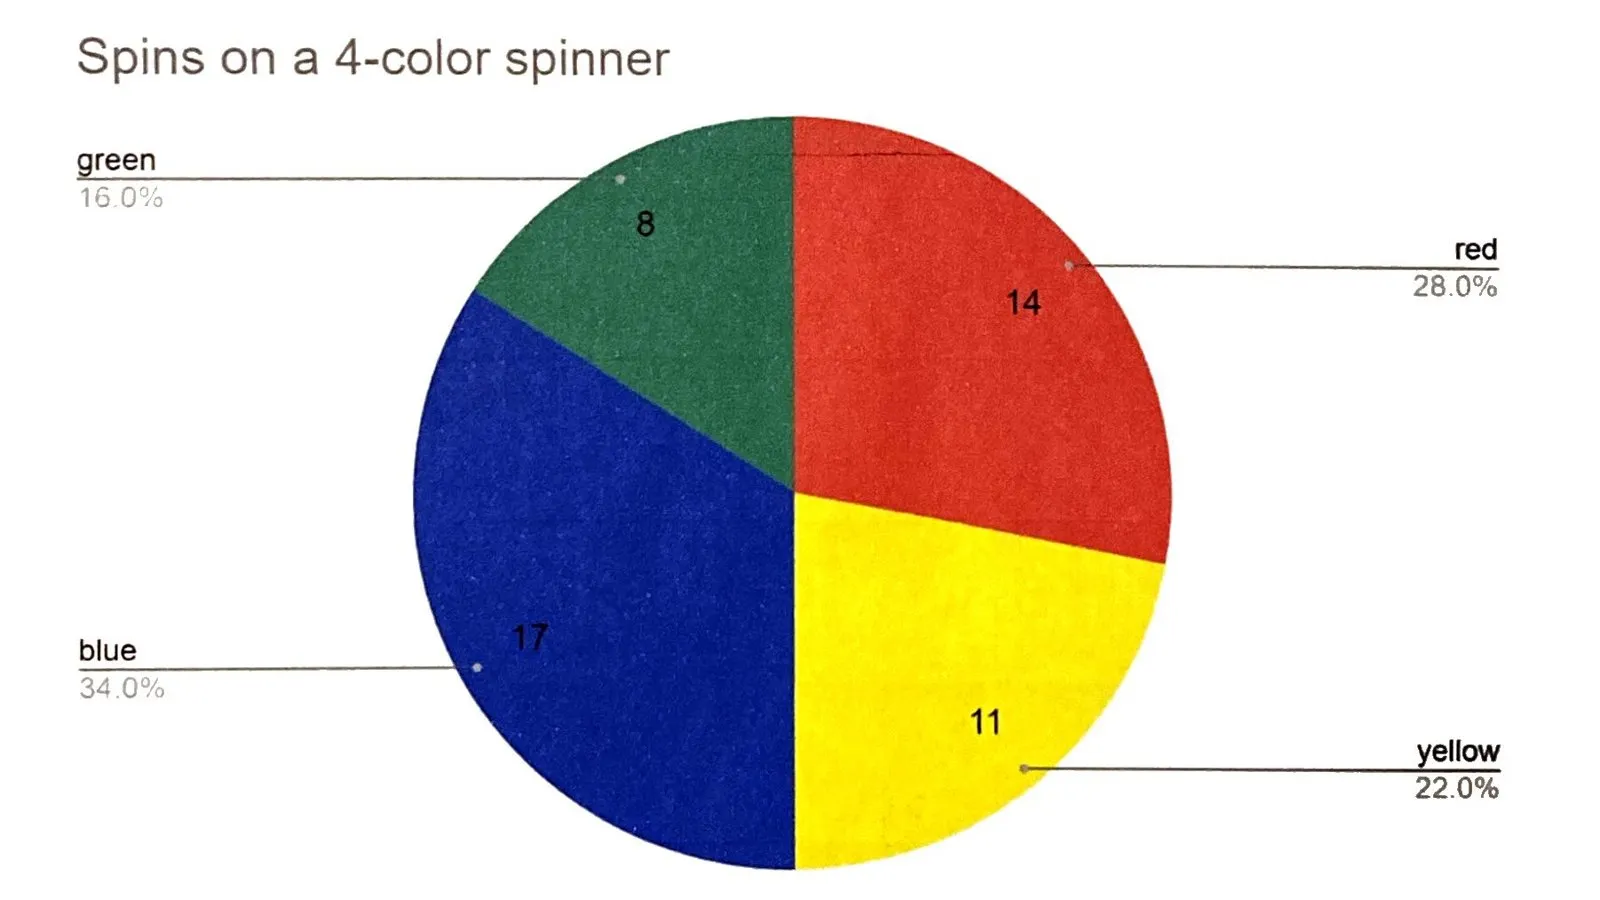
- Choose the chart type to suit the data: bar/column to compare categories; line to show change over time; pie to show parts of a whole (one series, percentages).
- Add labels and format the chart.
| Type | Best for |
|---|---|
| bar / column chart | comparing values in different categories |
| line graph | showing trends over time (continuous data) |
| pie chart | showing proportions (percentages) of a whole; only one data series |
2Labelling and formatting
| Item | Purpose |
|---|---|
| chart title | says what the chart shows |
| legend | identifies each data series by colour; not needed with one series unless asked |
| sector labels / values / percentages | on a pie chart: names, values or percentages of each sector |
| category axis title and labels | the x-axis title and the names of each category |
| value axis title and labels | the y-axis title and the numbers on the scale |
| data value labels | the value shown on each bar or point |
- Second data series: compare two sets of data on one chart. Second axis: when the series use very different scales or units (e.g. sales and price).
- Format numbers to a set number of decimal places or with a currency symbol.
- Set the axis scale: maximum, minimum and increment (major unit).
- Enhance: extract (pull out) a pie sector to emphasise it; change the colour scheme or fill patterns (useful when printing in black and white).
3Exam focus
Key words: contiguous; non-contiguous; chart type; legend; category axis; value axis; data label; second axis; extract sector.
Quick self-check
Answer in your head first, then reveal.
Pie chart (1).
When two data series have very different ranges/units (1) so both can be seen clearly (1).
Contiguous data is in adjacent cells/one block (1); non-contiguous is in separate ranges (1).